Database statistics#
mOTU taxonomy overview#
There are 124’295 mOTUs in release 4.1. Each mOTU has been annotated with the GTDB taxonomy (R226) based on the annotations of the genomes included within this mOTU.
Bacteria |
Archaea |
Total |
|
|---|---|---|---|
Phylum |
145 |
19 |
164 |
Class |
410 |
52 |
462 |
Order |
1,431 |
115 |
1,546 |
Family |
3,653 |
370 |
4,023 |
Genus |
15,904 |
1,090 |
16,994 |
mOTU |
120,445 |
3,850 |
124,295 |
Genome categories#
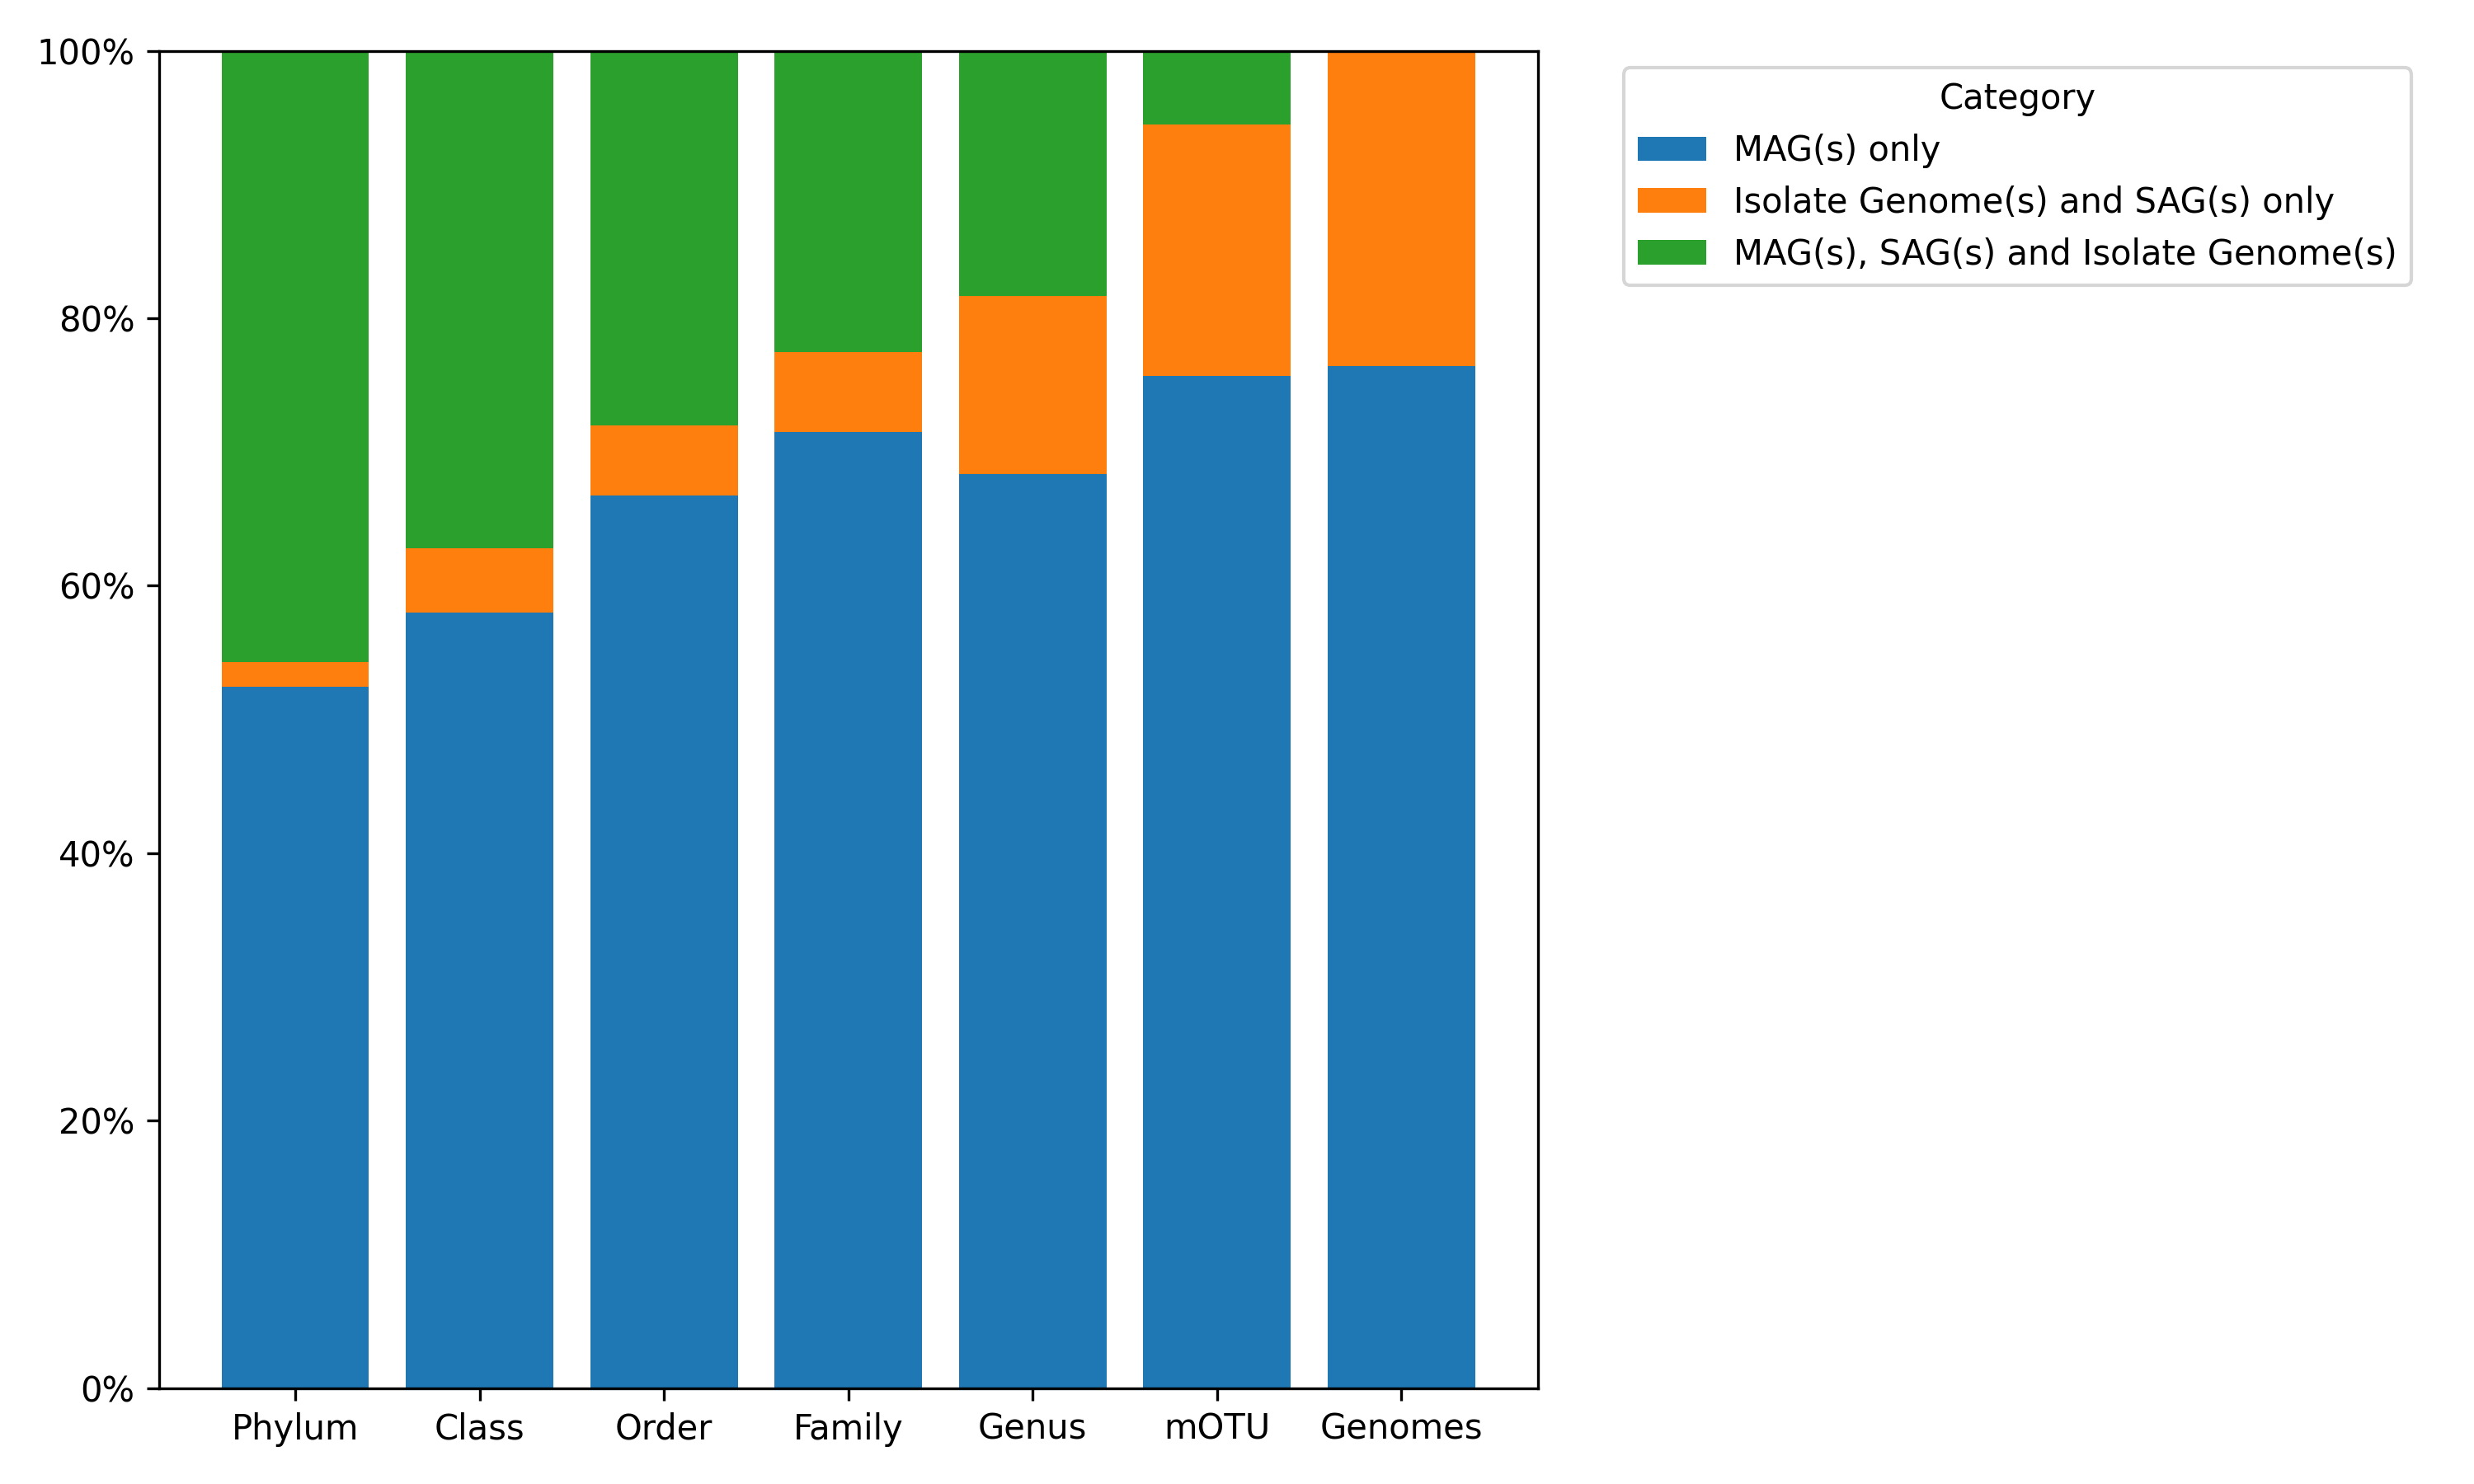
The mOTUs database contains ~3 million MAGs and ~1 million isolate/single-cell assembled genomes. The figure below shows the percentage of taxonomic ranks represented by MAGs only (blue), isolates and SAGs only (orange), or a combination (green). The rightmost Genomes bar reflects the proportion of MAGs within the entire database.
Quality of all genomes#
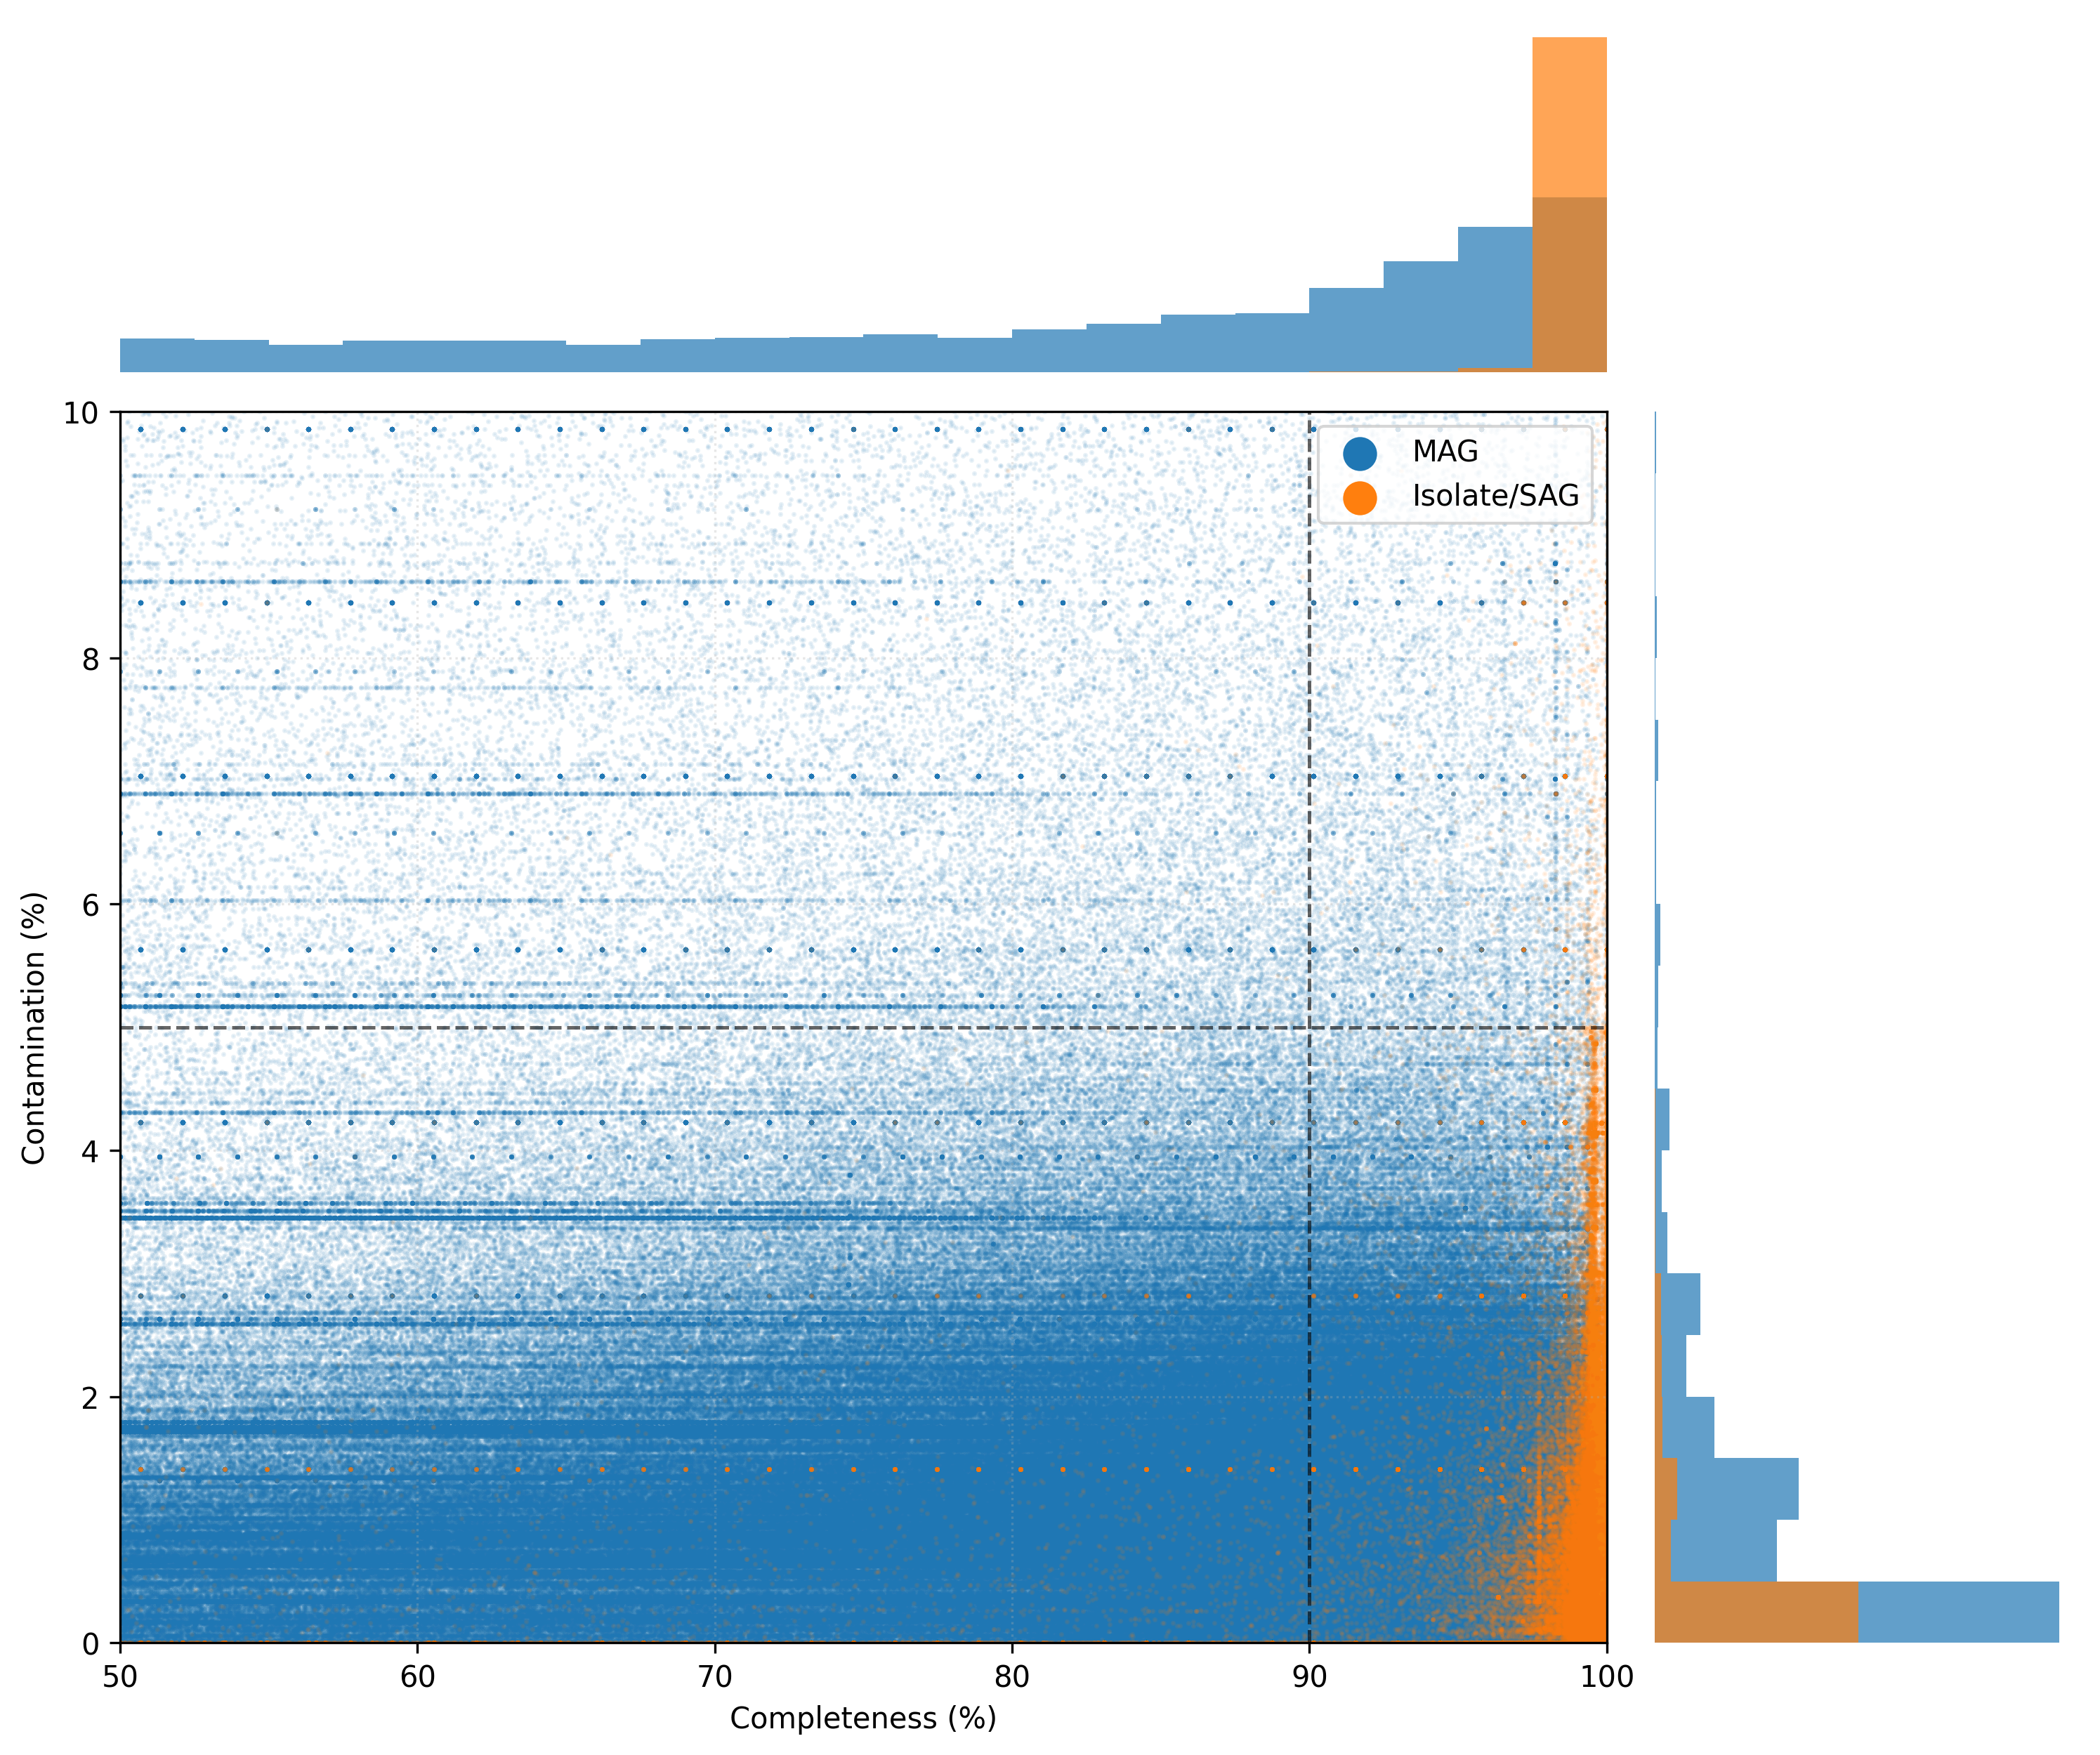
All genomes (~4 million) in the database were quality-controlled; bins with completeness below 50% or contamination above 10% were removed (exceptions were made for Eremiobacterota, see Paoli L et al., 2022). The figure below shows the quality distribution for all genomes.
Quality of representative genomes#
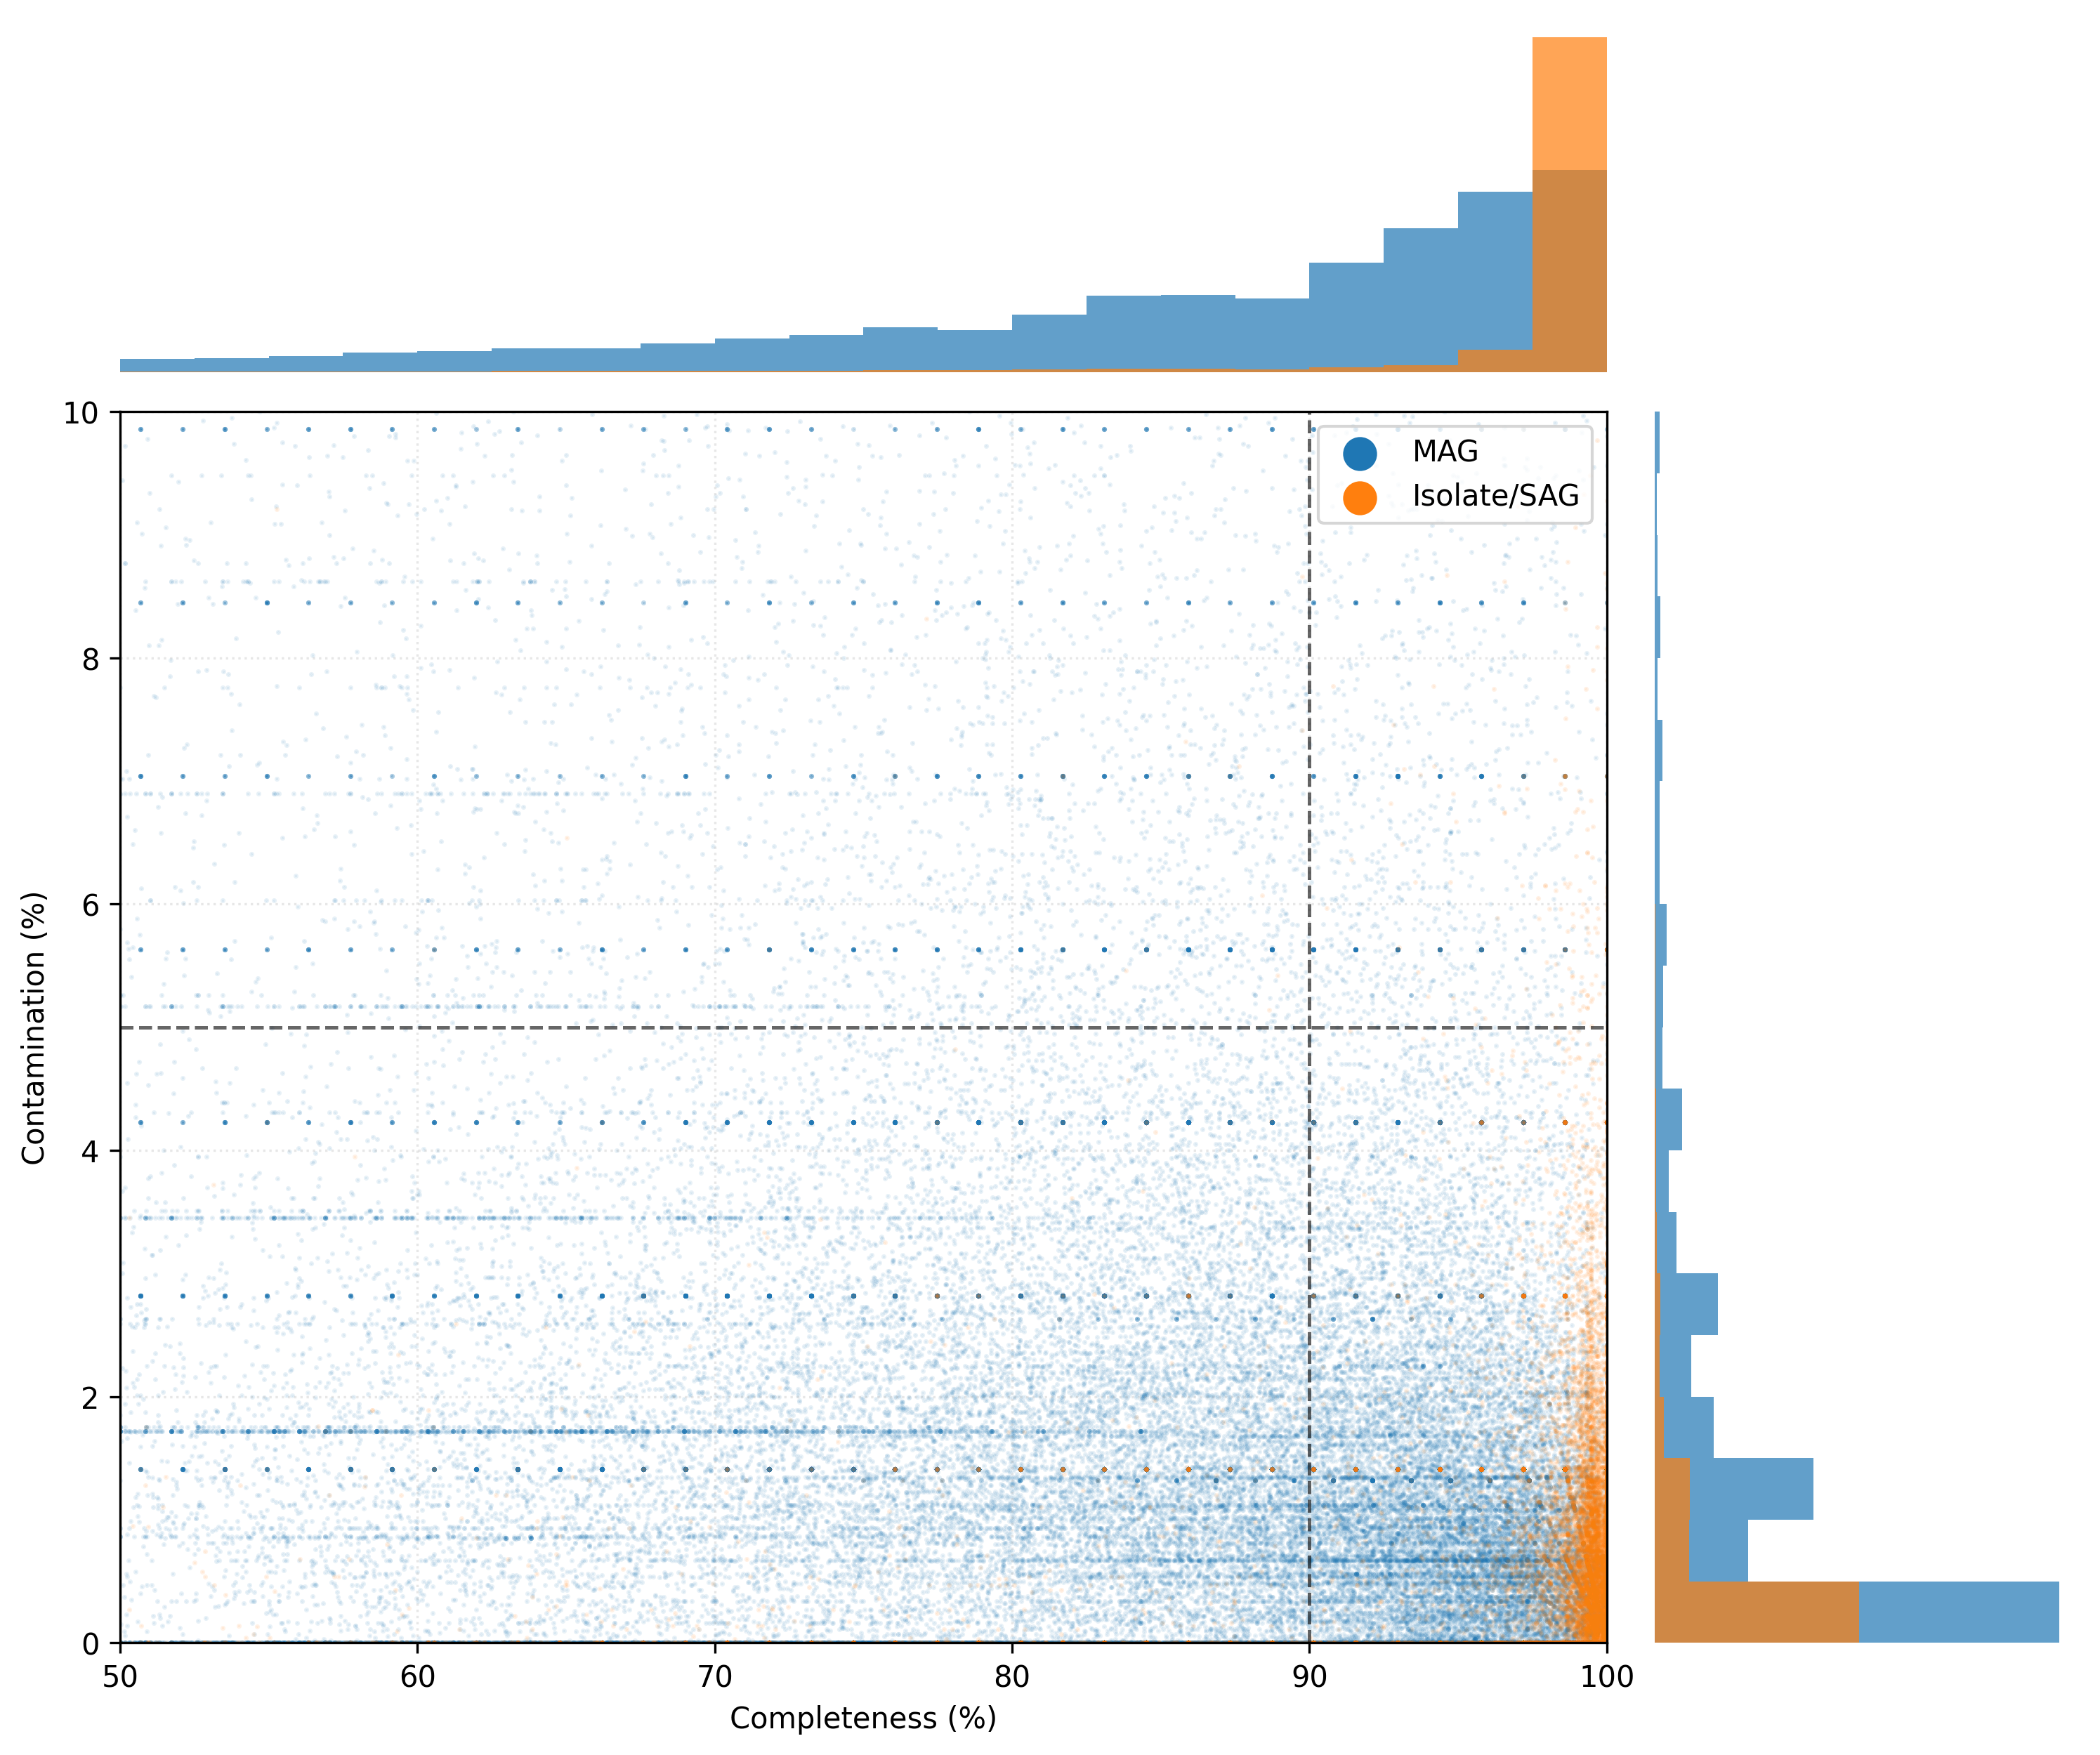
Representative genomes for each mOTU were selected based on a hierarchical scoring system designed to prioritize biological reliability and assembly quality.
Priority |
Criterion |
|---|---|
|
Isolate genomes and SAGs are preferred over MAGs. |
|
Highest Q-Score (Completeness - 5 * Contamination) |
|
Highest N50, i.e. half of the genome is contained in contigs of this length or longer. |
The figure below shows the quality distribution for representative genomes.
Taxa with the largest number of mOTUs#
The top ten clades encompassing the most mOTU species clusters (indicated in brackets) are shown below for each taxonomic rank.
Phylum |
Class |
Order |
Family |
Genus |
|---|---|---|---|---|
Pseudomonadota (30’707) |
Clostridia (19’431) |
Bacteroidales (8’738) |
Lachnospiraceae (4’213) |
Streptococcus (2’185) |
Bacillota (29’895) |
Bacteroidia (17’706) |
Oscillospirales (8’353) |
Burkholderiaceae (3’782) |
Collinsella (1’807) |
Bacteroidota (17’706) |
Gammaproteobacteria (17’207) |
Burkholderiales (5’789) |
Flavobacteriaceae (3’085) |
Nanosyncoccus (1’541) |
Actinomycetota (13’272) |
Alphaproteobacteria (13’459) |
Flavobacteriales (4’962) |
Bacteroidaceae (2’887) |
Prevotella (1’455) |
Patescibacteriota (5’738) |
Bacilli (9’086) |
Lachnospirales (4’461) |
Oscillospiraceae (2’514) |
Cryptobacteroides (1’164) |
Verrucomicrobiota (3’097) |
Actinomycetes (8’175) |
Pseudomonadales (3’770) |
Streptococcaceae (2’224) |
Faecousia (1’028) |
Chloroflexota (2’882) |
Saccharimonadia (3’365) |
Saccharimonadales (3’327) |
Rhodobacteraceae (2’219) |
Flavobacterium (894) |
Cyanobacteriota (2’277) |
Coriobacteriia (2’926) |
Actinomycetales (3’243) |
CAG-272 (2’115) |
Pelagibacter (886) |
Planctomycetota (1’869) |
Verrucomicrobiia (2’154) |
Lactobacillales (3’175) |
Acutalibacteraceae (2’034) |
Streptomyces (734) |
Acidobacteriota (1’766) |
Acidimicrobiia (1’695) |
Christensenellales (2’943) |
UBA660 (1’943) |
Colicola (715) |
Environmental annotations#
MAGs were reconstructed from >120K short-read metagenomic samples. Samples were annotated using a six-level hierarchical environmental ontology where metadata were available. To view and search all ontology categories, click here . The figure below shows the distribution of environments across samples.
Global distribution of environmental samples#
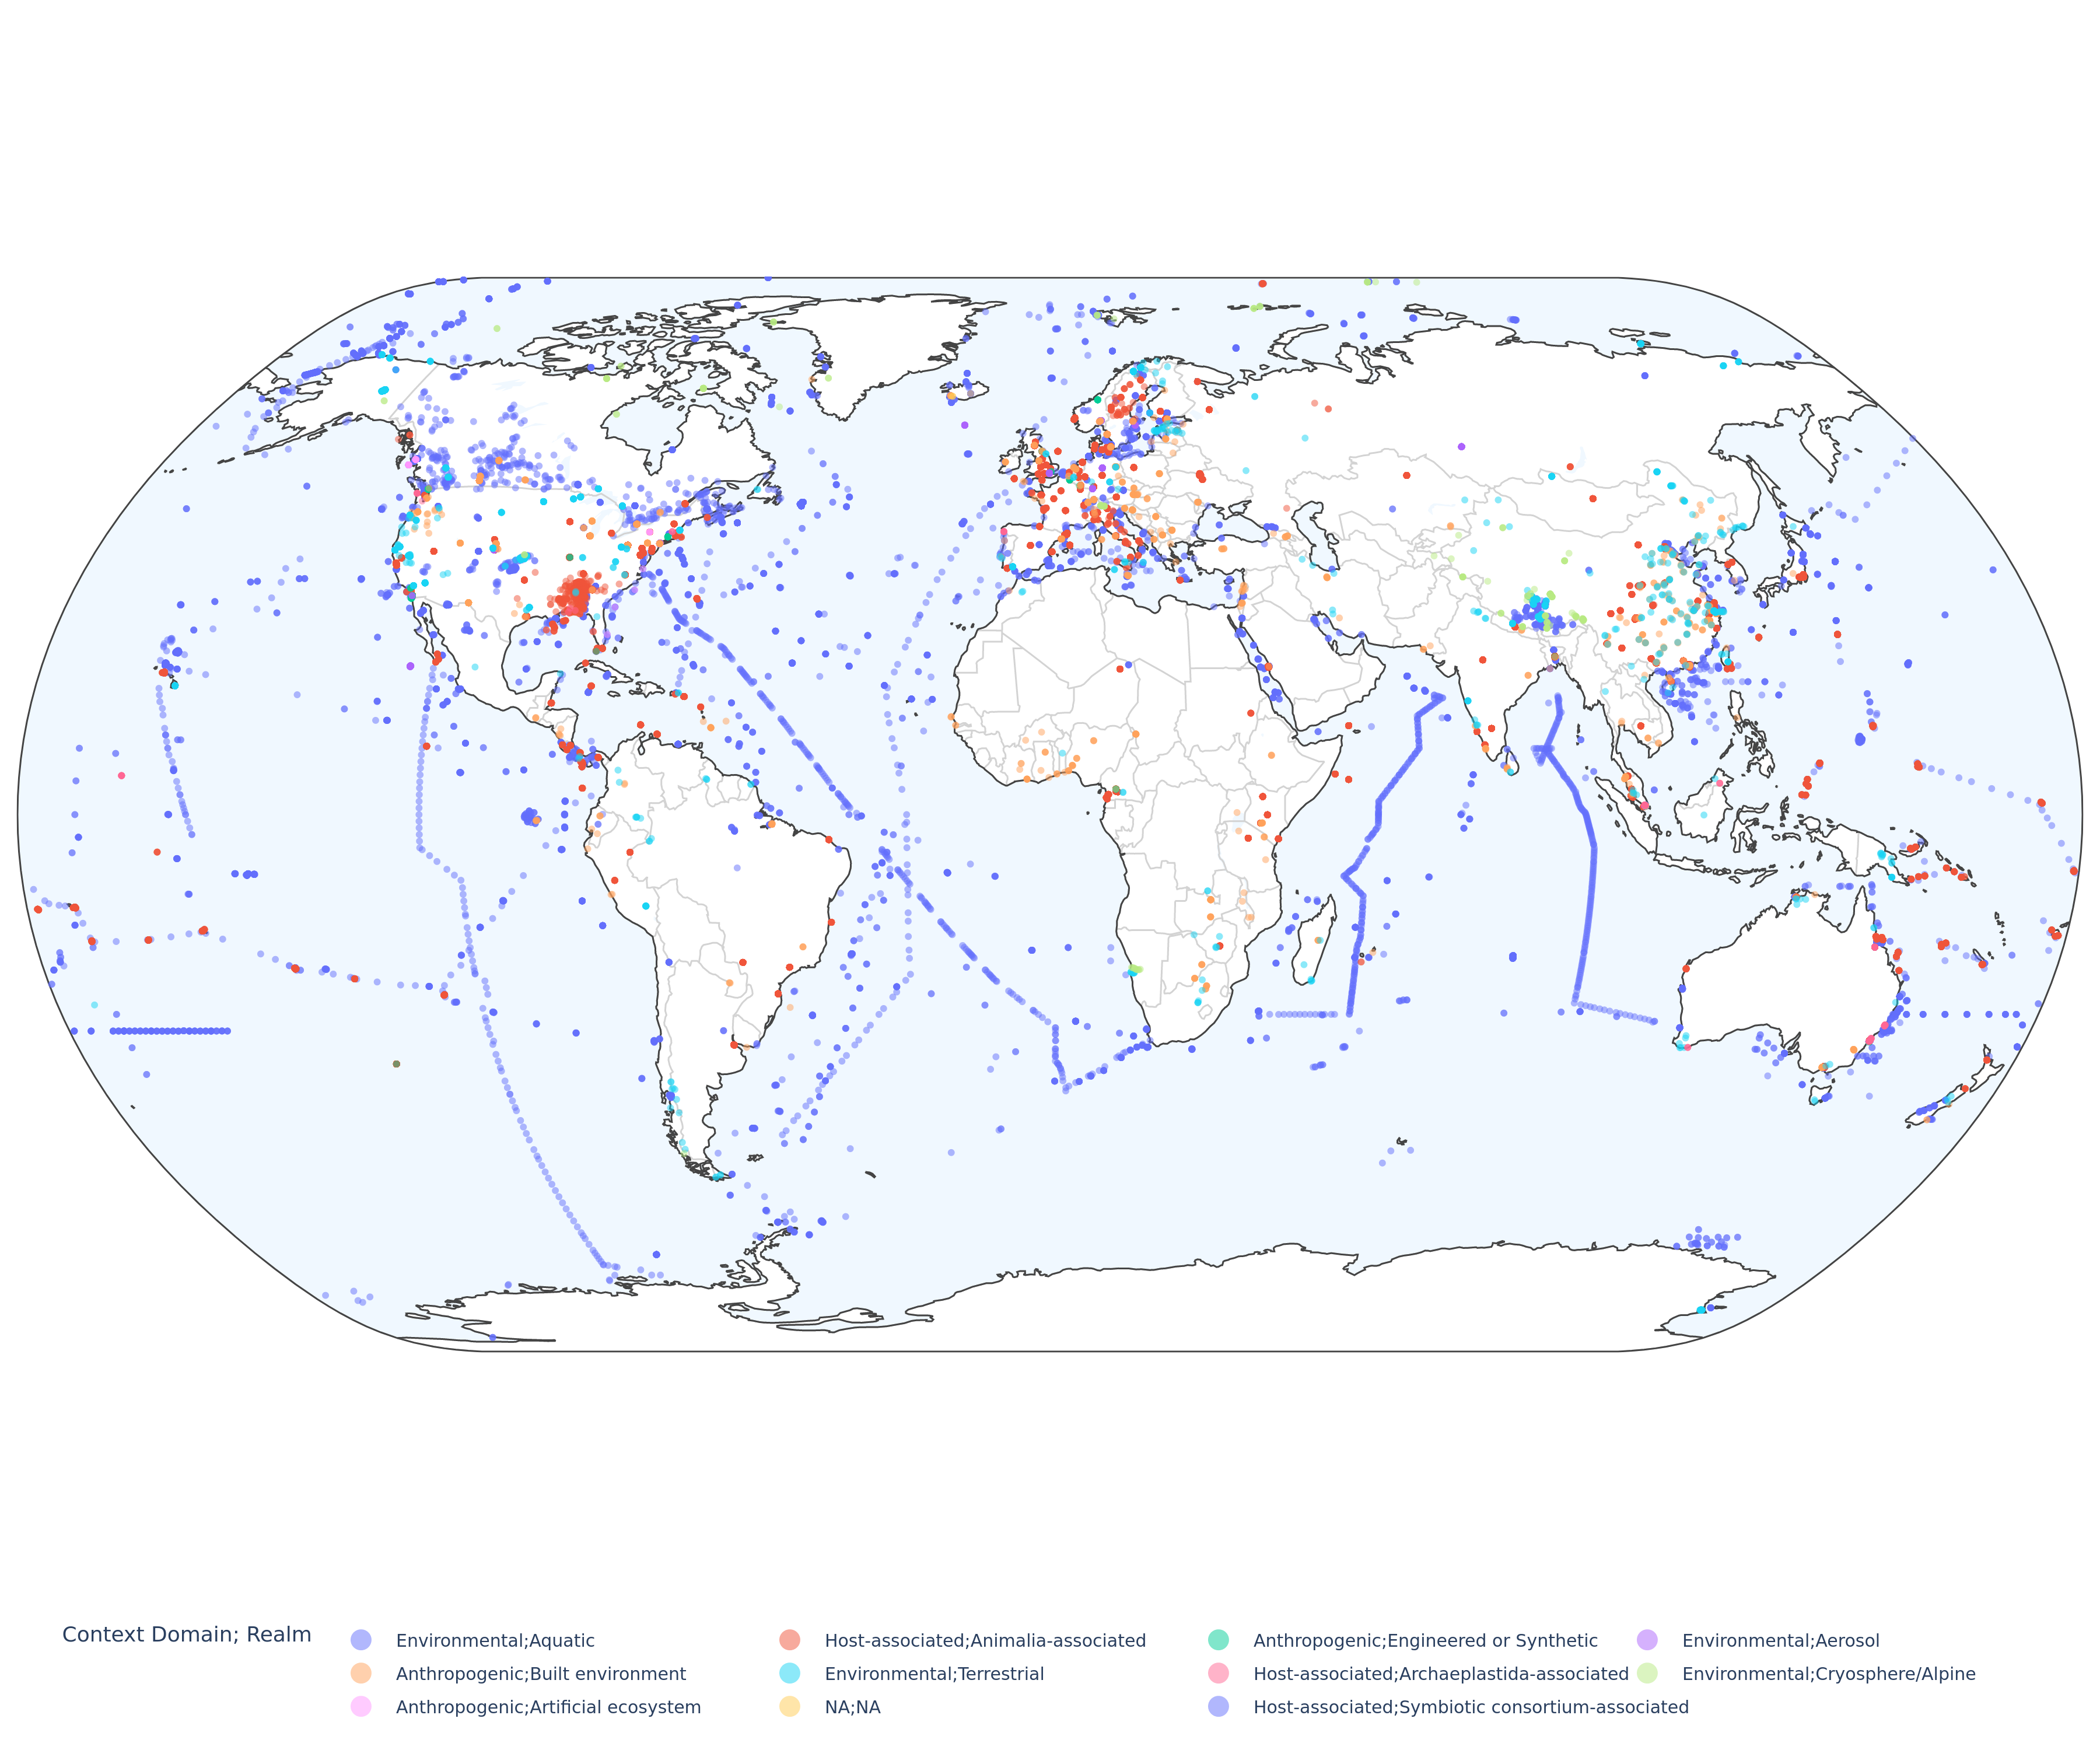
MAGs were reconstructed from >120K short-read metagenomic samples. Sample coordinates were annotated where metadata were available. The map below shows sample distribution, with colors corresponding to environmental annotations from the second level of the ontology.
 mOTUs is part of SIB's portfolio of open tools and databases.
 mOTUs is part of the ELIXIR-CH Service Delivery Plan.