Concept#
The mOTUs tool performs taxonomic profiling of metagenomic and metatranscriptomic samples, identifying species-level clusters (i.e. mOTUs) and quantifying their abundances in a microbial community sample.
These mOTUs are defined based on ten universal single-copy marker genes (MGs):
Gene family |
Name |
Description |
MG threshold (%) |
|---|---|---|---|
|
YchF |
Ribosome-binding ATPase |
94.7 |
|
PheS |
Phenylalanyl-tRNA synthetase alpha subunit |
96.7 |
|
ArgS |
Arginyl-tRNA synthetase |
95.7 |
|
SerS |
Seryl-tRNA synthetase |
96.6 |
|
CysS |
Cysteinyl-tRNA synthetase |
96.0 |
|
LeuS |
Leucyl-tRNA synthetase |
96.2 |
|
ValS |
Valyl-tRNA synthetase |
95.4 |
|
TsaD |
tRNA N6-adenosine threonylcarbamoyltransferase |
95.1 |
|
Srp/Ffh |
Signal recognition particle subunit SRP54 |
96.2 |
|
FtsY |
Fused signal recognition particle receptor |
95.7 |
The mOTUs genome database (mOTUs-db) is composed of:
Reference genomes available on NCBI RefSeq and GenBank databases, or the JGI Genome Portal. These are predominantly isolate culture genomes, but may also include single-cell assembled genomes (SAGs). As the source annotations may contain inaccuracies, the annotation of certain SAGs cannot be fully confirmed.
Metagenome-assembled genomes (MAGs) that have been systematically reconstructed from paired-end shotgun metagenomics samples (see overview in Table S4).
For the current release (v4.1), a total of 3.89M genomes have been processed with fetchMGs to extract MGs. Of these, 3.3M contained more than six MGs and were clustered with average-linkage clustering at >96.5% sequence identity, calculated across all overlapping MGs between each pair of genomes. This resulted in 124,295 mOTUs. For each of the 10 MGs, sequences were grouped by mOTU and clustered by the species-specific cutoff (see Table above). All but the biggest clusters were removed and the sequences of the remaining cluster were dereplicated at 99% similarity, creating a marker gene cluster.
In addition, fetchMGs was run on all assemblies from the shotgun metagenomics samples to extract unlinked MG variants.
These sequences were then clustered using MG-specific thresholds (see overview) to generate MGCs categorized under mOTUv4.0_unassigned, which enables quantification
of the unclassifiable fraction of the microbial community.
The resulting mOTUs marker gene database (mOTUs-MG-db) contains 3’436’253 sequences, which are used as the reference database in motus profile for mapping reads
and estimating abundances:
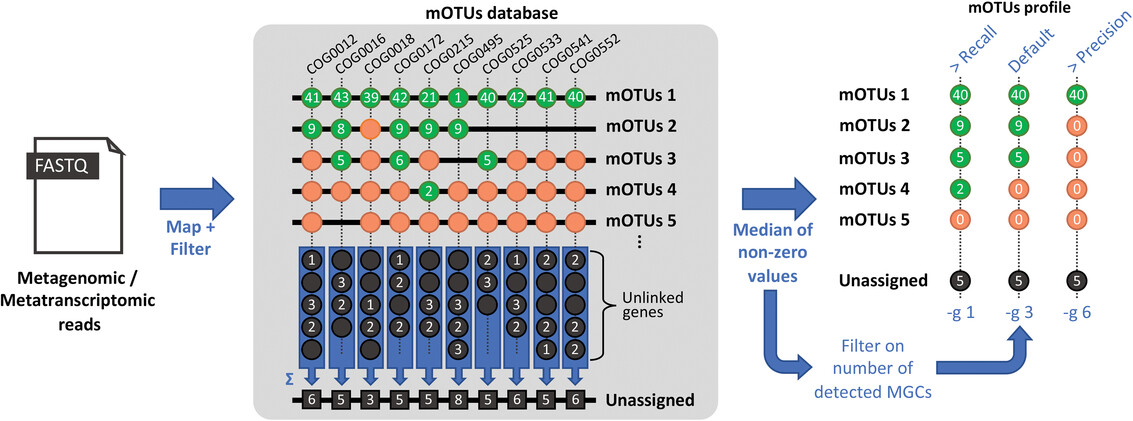
Abundance estimation by the mOTUs profiler. Metagenomic or metatranscriptomic reads are mapped against mOTUs-MG-db containing sequences from 10 MGs (COG0012, COG0016, etc.).
The minimum number of detected MGs, defined by -g, is used as a threshold for marking a mOTU as present. To quantify abundance, the median abundance across MGs corresponding
to the same mOTU is taken. For more details on quantification, see algorithm.#
![]() mOTUs is part of SIB's portfolio of open tools and databases.
mOTUs is part of SIB's portfolio of open tools and databases.
![]() mOTUs is part of the ELIXIR-CH Service Delivery Plan.
mOTUs is part of the ELIXIR-CH Service Delivery Plan.